Put your cloud bill next to revenue: total cost bars rise while the cost-per-customer line falls
Insight

Cloud Unit Economics: Read Your Cloud Bill Next to Revenue

OpsNow Team
2026-11-19

■ Problem: A rising cloud bill, on its own, can't tell you whether the increase is waste or growth.

■ Solution: Cloud unit economics divides cost by a business metric such as customers or transactions, so spending is read next to the value it creates.

■ Result: The month-end report that says "the bill went up again" turns into a meeting about how cost per customer moved.

Monday morning, executive meeting. A slide shows the cloud bill rising for the third month in a row, and the CFO asks, "So, is this bad?" The head of infrastructure knows customer sign-ups grew over the same period. He has just never put the two numbers in one table. Cloud unit economics fills exactly that gap.

What is cloud unit economics?

The FinOps Foundation describes Unit Economics as the capability that brings together what an organization spends on technology and the value that spending creates. Instead of the total, you look at cost per unit: per customer, per transaction, per support case resolved.

It starts with the denominator. Revenue is the most intuitive choice, but many companies can't split revenue by service. In that case, the FinOps Foundation notes that proxies such as demand, throughput or service levels can be used.

What happens when you only watch the total

The total goes up when the business grows. It also goes up when waste grows. Both show up as the same number, so the meeting swings between "cut it" and "we need this."

Unit cost separates the two. If the total rises while cost per customer falls, economies of scale are at work. When the total and the unit cost rise together, you finally have a place to look.

Before and after: how the meeting changes

Before, finance reports the CSP bills as a single total at month-end, and the infrastructure team explains the increase service by service in a separate thread. Customer counts and revenue figures come from a different person in a different meeting.

After, one report shows total cost and cost per customer side by side. The CFO's question narrows from "why did it go up?" to "why did unit cost rise for this one service?" What needs explaining shrinks from the whole bill to a single service.
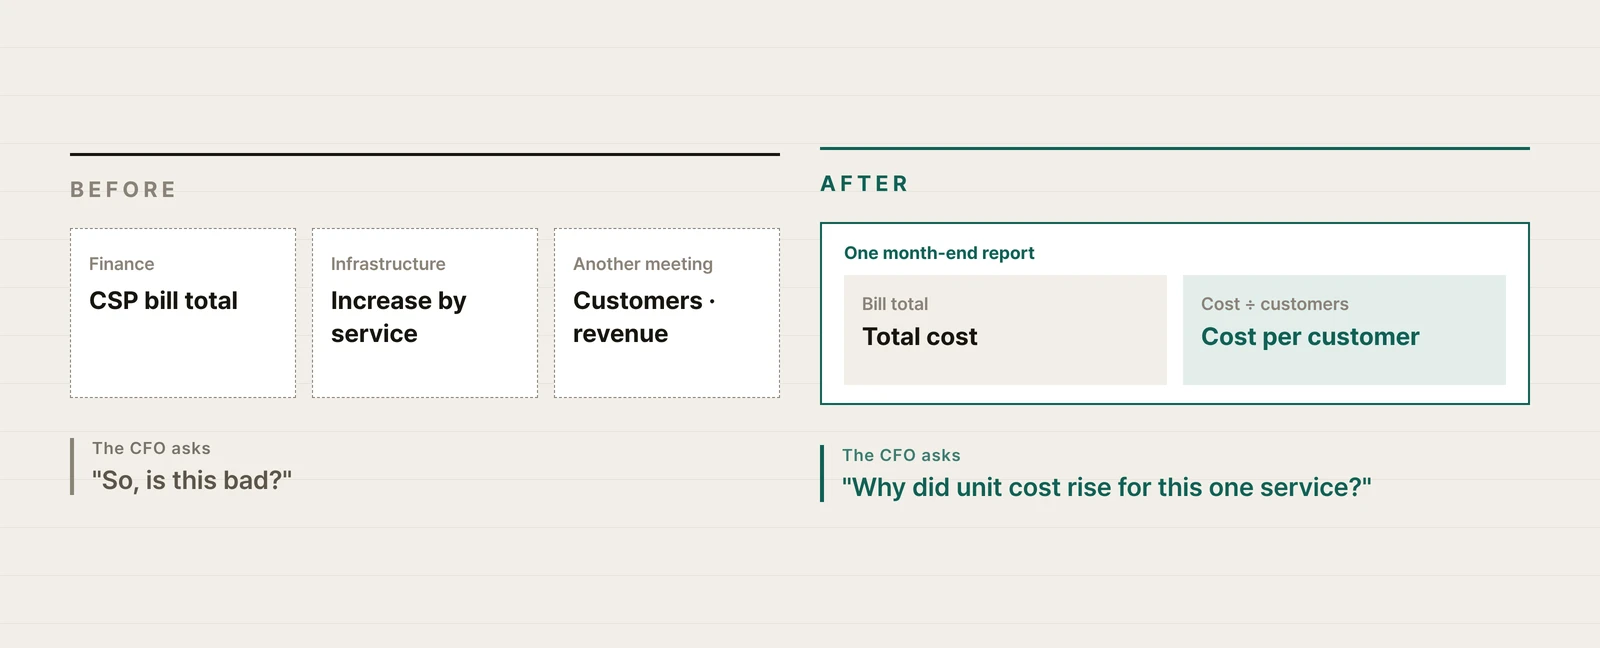
Diagram comparing separate reporting of total cost and customer count before, with cost per customer shown in one report after
Total cost and business metrics, once reported apart, connect through one unit cost line.

A small way to start

In the FinOps Foundation maturity model, unit metrics at the first stage (Crawl) are mostly technical: cost per GB, per vCPU, per token. Bringing in shared costs and fully loaded costs belongs to the next stage (Walk).

So there is no need to aim for a perfect fully loaded cost per customer on day one. Pick one service whose cost moves a lot, choose one denominator, and first separate which costs belong to that service with tags and allocation rules.

If your costs are spread across several clouds, bringing them into one place comes even earlier. OpsNow brings together costs from five CSPs (AWS, Azure, GCP, OCI and Naver Cloud), the widest CSP coverage in Korea.

The next time that question comes up in the executive meeting, the slide only needs one more line: cost per customer.

▶ Talk to OpsNow about your cloud costs

Frequently Asked Questions

Q. Which cloud unit economics metric should we define first?

Start with one business metric that moves with cost. For a transaction-based service, use transaction count. For a subscription service, use customer count. Numbers you already track every month work best.

Q. What if we can't split revenue by service?

Use a proxy. The FinOps Foundation notes that when revenue is hard to split, metrics such as demand, throughput or service levels can be used.

Q. Should shared costs be included in unit cost?

Not at first. In the FinOps Foundation maturity model, the first stage focuses on direct variable costs, and fully loaded costs including shared costs come in the next stage.

Get Started Today with OpsNow

Put your cloud bill next to revenue: total cost bars rise while the cost-per-customer line falls
Insight

Cloud Unit Economics: Read Your Cloud Bill Next to Revenue

OpsNow Team
2026-11-19

■ Problem: A rising cloud bill, on its own, can't tell you whether the increase is waste or growth.

■ Solution: Cloud unit economics divides cost by a business metric such as customers or transactions, so spending is read next to the value it creates.

■ Result: The month-end report that says "the bill went up again" turns into a meeting about how cost per customer moved.

Monday morning, executive meeting. A slide shows the cloud bill rising for the third month in a row, and the CFO asks, "So, is this bad?" The head of infrastructure knows customer sign-ups grew over the same period. He has just never put the two numbers in one table. Cloud unit economics fills exactly that gap.

What is cloud unit economics?

The FinOps Foundation describes Unit Economics as the capability that brings together what an organization spends on technology and the value that spending creates. Instead of the total, you look at cost per unit: per customer, per transaction, per support case resolved.

It starts with the denominator. Revenue is the most intuitive choice, but many companies can't split revenue by service. In that case, the FinOps Foundation notes that proxies such as demand, throughput or service levels can be used.

What happens when you only watch the total

The total goes up when the business grows. It also goes up when waste grows. Both show up as the same number, so the meeting swings between "cut it" and "we need this."

Unit cost separates the two. If the total rises while cost per customer falls, economies of scale are at work. When the total and the unit cost rise together, you finally have a place to look.

Before and after: how the meeting changes

Before, finance reports the CSP bills as a single total at month-end, and the infrastructure team explains the increase service by service in a separate thread. Customer counts and revenue figures come from a different person in a different meeting.

After, one report shows total cost and cost per customer side by side. The CFO's question narrows from "why did it go up?" to "why did unit cost rise for this one service?" What needs explaining shrinks from the whole bill to a single service.

Diagram comparing separate reporting of total cost and customer count before, with cost per customer shown in one report after
Total cost and business metrics, once reported apart, connect through one unit cost line.

A small way to start

In the FinOps Foundation maturity model, unit metrics at the first stage (Crawl) are mostly technical: cost per GB, per vCPU, per token. Bringing in shared costs and fully loaded costs belongs to the next stage (Walk).

So there is no need to aim for a perfect fully loaded cost per customer on day one. Pick one service whose cost moves a lot, choose one denominator, and first separate which costs belong to that service with tags and allocation rules.

If your costs are spread across several clouds, bringing them into one place comes even earlier. OpsNow brings together costs from five CSPs (AWS, Azure, GCP, OCI and Naver Cloud), the widest CSP coverage in Korea.

The next time that question comes up in the executive meeting, the slide only needs one more line: cost per customer.

▶ Talk to OpsNow about your cloud costs

Frequently Asked Questions

Q. Which cloud unit economics metric should we define first?

Start with one business metric that moves with cost. For a transaction-based service, use transaction count. For a subscription service, use customer count. Numbers you already track every month work best.

Q. What if we can't split revenue by service?

Use a proxy. The FinOps Foundation notes that when revenue is hard to split, metrics such as demand, throughput or service levels can be used.

Q. Should shared costs be included in unit cost?

Not at first. In the FinOps Foundation maturity model, the first stage focuses on direct variable costs, and fully loaded costs including shared costs come in the next stage.

Cloud Unit Economics: Read Your Cloud Bill Next to Revenue

■ Problem: A rising cloud bill, on its own, can't tell you whether the increase is waste or growth.

■ Solution: Cloud unit economics divides cost by a business metric such as customers or transactions, so spending is read next to the value it creates.

■ Result: The month-end report that says "the bill went up again" turns into a meeting about how cost per customer moved.

Monday morning, executive meeting. A slide shows the cloud bill rising for the third month in a row, and the CFO asks, "So, is this bad?" The head of infrastructure knows customer sign-ups grew over the same period. He has just never put the two numbers in one table. Cloud unit economics fills exactly that gap.

What is cloud unit economics?

The FinOps Foundation describes Unit Economics as the capability that brings together what an organization spends on technology and the value that spending creates. Instead of the total, you look at cost per unit: per customer, per transaction, per support case resolved.

It starts with the denominator. Revenue is the most intuitive choice, but many companies can't split revenue by service. In that case, the FinOps Foundation notes that proxies such as demand, throughput or service levels can be used.

What happens when you only watch the total

The total goes up when the business grows. It also goes up when waste grows. Both show up as the same number, so the meeting swings between "cut it" and "we need this."

Unit cost separates the two. If the total rises while cost per customer falls, economies of scale are at work. When the total and the unit cost rise together, you finally have a place to look.

Before and after: how the meeting changes

Before, finance reports the CSP bills as a single total at month-end, and the infrastructure team explains the increase service by service in a separate thread. Customer counts and revenue figures come from a different person in a different meeting.

After, one report shows total cost and cost per customer side by side. The CFO's question narrows from "why did it go up?" to "why did unit cost rise for this one service?" What needs explaining shrinks from the whole bill to a single service.

Diagram comparing separate reporting of total cost and customer count before, with cost per customer shown in one report after
Total cost and business metrics, once reported apart, connect through one unit cost line.

A small way to start

In the FinOps Foundation maturity model, unit metrics at the first stage (Crawl) are mostly technical: cost per GB, per vCPU, per token. Bringing in shared costs and fully loaded costs belongs to the next stage (Walk).

So there is no need to aim for a perfect fully loaded cost per customer on day one. Pick one service whose cost moves a lot, choose one denominator, and first separate which costs belong to that service with tags and allocation rules.

If your costs are spread across several clouds, bringing them into one place comes even earlier. OpsNow brings together costs from five CSPs (AWS, Azure, GCP, OCI and Naver Cloud), the widest CSP coverage in Korea.

The next time that question comes up in the executive meeting, the slide only needs one more line: cost per customer.

▶ Talk to OpsNow about your cloud costs

Frequently Asked Questions

Q. Which cloud unit economics metric should we define first?

Start with one business metric that moves with cost. For a transaction-based service, use transaction count. For a subscription service, use customer count. Numbers you already track every month work best.

Q. What if we can't split revenue by service?

Use a proxy. The FinOps Foundation notes that when revenue is hard to split, metrics such as demand, throughput or service levels can be used.

Q. Should shared costs be included in unit cost?

Not at first. In the FinOps Foundation maturity model, the first stage focuses on direct variable costs, and fully loaded costs including shared costs come in the next stage.

Download it for free
Submit the information below and get the files you need right away
Name *
Company *
Business Email *
By registering an inquiry, you agree to allow OpsNow to store and process your information for contact purposes.
Please read our Privacy Policy for more information.
Thank you.
The file has been downloaded.
Please enter all required fields.
Put your cloud bill next to revenue: total cost bars rise while the cost-per-customer line falls

Cloud Unit Economics: Read Your Cloud Bill Next to Revenue

OpsNow Team
2026-11-19

■ Problem: A rising cloud bill, on its own, can't tell you whether the increase is waste or growth.

■ Solution: Cloud unit economics divides cost by a business metric such as customers or transactions, so spending is read next to the value it creates.

■ Result: The month-end report that says "the bill went up again" turns into a meeting about how cost per customer moved.

Monday morning, executive meeting. A slide shows the cloud bill rising for the third month in a row, and the CFO asks, "So, is this bad?" The head of infrastructure knows customer sign-ups grew over the same period. He has just never put the two numbers in one table. Cloud unit economics fills exactly that gap.

What is cloud unit economics?

The FinOps Foundation describes Unit Economics as the capability that brings together what an organization spends on technology and the value that spending creates. Instead of the total, you look at cost per unit: per customer, per transaction, per support case resolved.

It starts with the denominator. Revenue is the most intuitive choice, but many companies can't split revenue by service. In that case, the FinOps Foundation notes that proxies such as demand, throughput or service levels can be used.

What happens when you only watch the total

The total goes up when the business grows. It also goes up when waste grows. Both show up as the same number, so the meeting swings between "cut it" and "we need this."

Unit cost separates the two. If the total rises while cost per customer falls, economies of scale are at work. When the total and the unit cost rise together, you finally have a place to look.

Before and after: how the meeting changes

Before, finance reports the CSP bills as a single total at month-end, and the infrastructure team explains the increase service by service in a separate thread. Customer counts and revenue figures come from a different person in a different meeting.

After, one report shows total cost and cost per customer side by side. The CFO's question narrows from "why did it go up?" to "why did unit cost rise for this one service?" What needs explaining shrinks from the whole bill to a single service.

Diagram comparing separate reporting of total cost and customer count before, with cost per customer shown in one report after
Total cost and business metrics, once reported apart, connect through one unit cost line.

A small way to start

In the FinOps Foundation maturity model, unit metrics at the first stage (Crawl) are mostly technical: cost per GB, per vCPU, per token. Bringing in shared costs and fully loaded costs belongs to the next stage (Walk).

So there is no need to aim for a perfect fully loaded cost per customer on day one. Pick one service whose cost moves a lot, choose one denominator, and first separate which costs belong to that service with tags and allocation rules.

If your costs are spread across several clouds, bringing them into one place comes even earlier. OpsNow brings together costs from five CSPs (AWS, Azure, GCP, OCI and Naver Cloud), the widest CSP coverage in Korea.

The next time that question comes up in the executive meeting, the slide only needs one more line: cost per customer.

▶ Talk to OpsNow about your cloud costs

Frequently Asked Questions

Q. Which cloud unit economics metric should we define first?

Start with one business metric that moves with cost. For a transaction-based service, use transaction count. For a subscription service, use customer count. Numbers you already track every month work best.

Q. What if we can't split revenue by service?

Use a proxy. The FinOps Foundation notes that when revenue is hard to split, metrics such as demand, throughput or service levels can be used.

Q. Should shared costs be included in unit cost?

Not at first. In the FinOps Foundation maturity model, the first stage focuses on direct variable costs, and fully loaded costs including shared costs come in the next stage.

Cloud Unit Economics: Read Your Cloud Bill Next to Revenue

OpsNow Team
2026-11-19

■ Problem: A rising cloud bill, on its own, can't tell you whether the increase is waste or growth.

■ Solution: Cloud unit economics divides cost by a business metric such as customers or transactions, so spending is read next to the value it creates.

■ Result: The month-end report that says "the bill went up again" turns into a meeting about how cost per customer moved.

Monday morning, executive meeting. A slide shows the cloud bill rising for the third month in a row, and the CFO asks, "So, is this bad?" The head of infrastructure knows customer sign-ups grew over the same period. He has just never put the two numbers in one table. Cloud unit economics fills exactly that gap.

What is cloud unit economics?

The FinOps Foundation describes Unit Economics as the capability that brings together what an organization spends on technology and the value that spending creates. Instead of the total, you look at cost per unit: per customer, per transaction, per support case resolved.

It starts with the denominator. Revenue is the most intuitive choice, but many companies can't split revenue by service. In that case, the FinOps Foundation notes that proxies such as demand, throughput or service levels can be used.

What happens when you only watch the total

The total goes up when the business grows. It also goes up when waste grows. Both show up as the same number, so the meeting swings between "cut it" and "we need this."

Unit cost separates the two. If the total rises while cost per customer falls, economies of scale are at work. When the total and the unit cost rise together, you finally have a place to look.

Before and after: how the meeting changes

Before, finance reports the CSP bills as a single total at month-end, and the infrastructure team explains the increase service by service in a separate thread. Customer counts and revenue figures come from a different person in a different meeting.

After, one report shows total cost and cost per customer side by side. The CFO's question narrows from "why did it go up?" to "why did unit cost rise for this one service?" What needs explaining shrinks from the whole bill to a single service.

Diagram comparing separate reporting of total cost and customer count before, with cost per customer shown in one report after
Total cost and business metrics, once reported apart, connect through one unit cost line.

A small way to start

In the FinOps Foundation maturity model, unit metrics at the first stage (Crawl) are mostly technical: cost per GB, per vCPU, per token. Bringing in shared costs and fully loaded costs belongs to the next stage (Walk).

So there is no need to aim for a perfect fully loaded cost per customer on day one. Pick one service whose cost moves a lot, choose one denominator, and first separate which costs belong to that service with tags and allocation rules.

If your costs are spread across several clouds, bringing them into one place comes even earlier. OpsNow brings together costs from five CSPs (AWS, Azure, GCP, OCI and Naver Cloud), the widest CSP coverage in Korea.

The next time that question comes up in the executive meeting, the slide only needs one more line: cost per customer.

▶ Talk to OpsNow about your cloud costs

Frequently Asked Questions

Q. Which cloud unit economics metric should we define first?

Start with one business metric that moves with cost. For a transaction-based service, use transaction count. For a subscription service, use customer count. Numbers you already track every month work best.

Q. What if we can't split revenue by service?

Use a proxy. The FinOps Foundation notes that when revenue is hard to split, metrics such as demand, throughput or service levels can be used.

Q. Should shared costs be included in unit cost?

Not at first. In the FinOps Foundation maturity model, the first stage focuses on direct variable costs, and fully loaded costs including shared costs come in the next stage.

Put your cloud bill next to revenue: total cost bars rise while the cost-per-customer line falls
Insight

Cloud Unit Economics: Read Your Cloud Bill Next to Revenue

OpsNow Team
2026-11-19

■ Problem: A rising cloud bill, on its own, can't tell you whether the increase is waste or growth.

■ Solution: Cloud unit economics divides cost by a business metric such as customers or transactions, so spending is read next to the value it creates.

■ Result: The month-end report that says "the bill went up again" turns into a meeting about how cost per customer moved.

Monday morning, executive meeting. A slide shows the cloud bill rising for the third month in a row, and the CFO asks, "So, is this bad?" The head of infrastructure knows customer sign-ups grew over the same period. He has just never put the two numbers in one table. Cloud unit economics fills exactly that gap.

What is cloud unit economics?

The FinOps Foundation describes Unit Economics as the capability that brings together what an organization spends on technology and the value that spending creates. Instead of the total, you look at cost per unit: per customer, per transaction, per support case resolved.

It starts with the denominator. Revenue is the most intuitive choice, but many companies can't split revenue by service. In that case, the FinOps Foundation notes that proxies such as demand, throughput or service levels can be used.

What happens when you only watch the total

The total goes up when the business grows. It also goes up when waste grows. Both show up as the same number, so the meeting swings between "cut it" and "we need this."

Unit cost separates the two. If the total rises while cost per customer falls, economies of scale are at work. When the total and the unit cost rise together, you finally have a place to look.

Before and after: how the meeting changes

Before, finance reports the CSP bills as a single total at month-end, and the infrastructure team explains the increase service by service in a separate thread. Customer counts and revenue figures come from a different person in a different meeting.

After, one report shows total cost and cost per customer side by side. The CFO's question narrows from "why did it go up?" to "why did unit cost rise for this one service?" What needs explaining shrinks from the whole bill to a single service.

Diagram comparing separate reporting of total cost and customer count before, with cost per customer shown in one report after
Total cost and business metrics, once reported apart, connect through one unit cost line.

A small way to start

In the FinOps Foundation maturity model, unit metrics at the first stage (Crawl) are mostly technical: cost per GB, per vCPU, per token. Bringing in shared costs and fully loaded costs belongs to the next stage (Walk).

So there is no need to aim for a perfect fully loaded cost per customer on day one. Pick one service whose cost moves a lot, choose one denominator, and first separate which costs belong to that service with tags and allocation rules.

If your costs are spread across several clouds, bringing them into one place comes even earlier. OpsNow brings together costs from five CSPs (AWS, Azure, GCP, OCI and Naver Cloud), the widest CSP coverage in Korea.

The next time that question comes up in the executive meeting, the slide only needs one more line: cost per customer.

▶ Talk to OpsNow about your cloud costs

Frequently Asked Questions

Q. Which cloud unit economics metric should we define first?

Start with one business metric that moves with cost. For a transaction-based service, use transaction count. For a subscription service, use customer count. Numbers you already track every month work best.

Q. What if we can't split revenue by service?

Use a proxy. The FinOps Foundation notes that when revenue is hard to split, metrics such as demand, throughput or service levels can be used.

Q. Should shared costs be included in unit cost?

Not at first. In the FinOps Foundation maturity model, the first stage focuses on direct variable costs, and fully loaded costs including shared costs come in the next stage.